Lessons from the trenches - IOWait
This is the first in a series of blog posts that I will detail various lessons I have learned from Javabean Hosting.
IOIOIOIOIOIOIOWait
IOWait is the measurement of time that a computer spends waiting for data to be returned by it's hard drives. In terms of web hosting, IOWait is directly proportional to response time. This is because the CPU is effectively stuck waiting for the hard drives to return the contents of your web page to complete the request.
Let's take a look at some real world data in more detail.
Cascading ripples
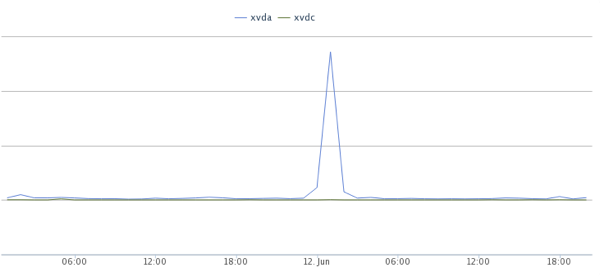
The following graph is the response time from one of Javabean Hosting's storage disks. The impending spike is a result of slow disk access from one of the arrays. This may be due to excessive searching or slow network access.

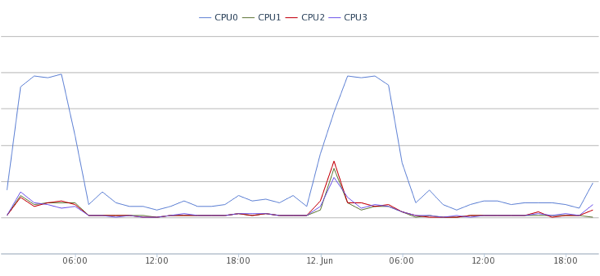
Due to the blip in response time from the disks, let's look at the corresponding response in the IOWait metric. The following graph shows the CPU utilization during the corresponding time period.

Yikes, right? Thankfully, we've built in mechanisms to deal with this automatically. It is, however, very important to note the correlation between the two graphs.
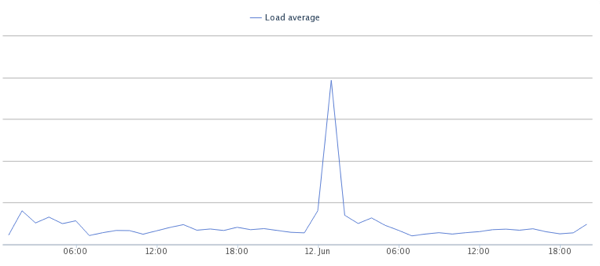
Finally, and most importantly, we should look at the overall system load. Notice a similar spike in the overall system load during the same time period.

What does this all mean?
IOWait is an important metric to monitor and understand in web hosting. In order to maximizethe response time for a website, IOWait must be minimized. At Javabean Hosting, we stay on top of these things to make sure your site is always fast and responsive.